ROLE

Data Product Manager at Capital Group

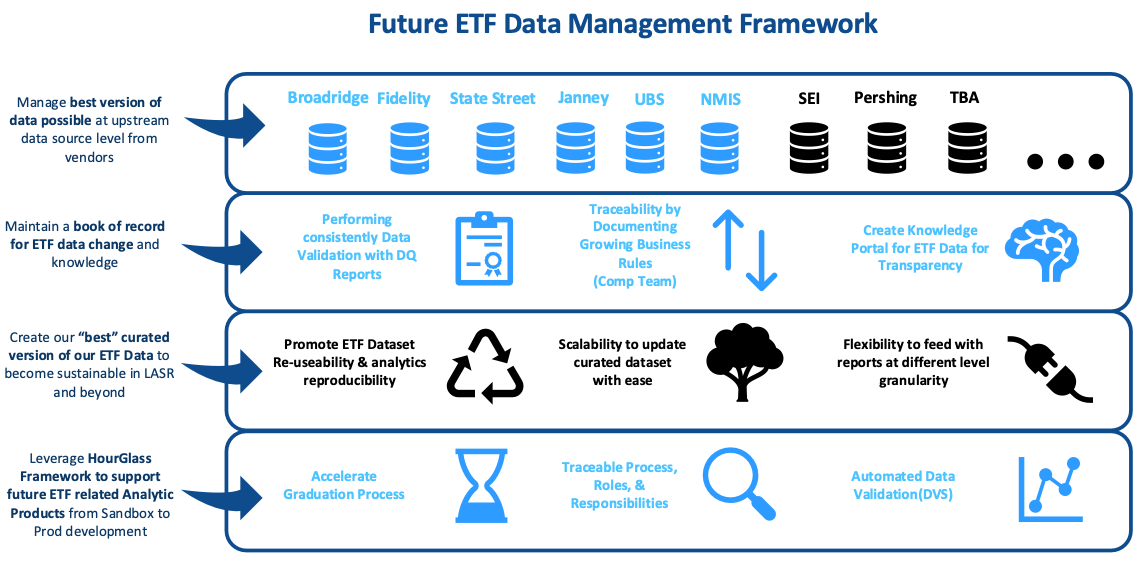
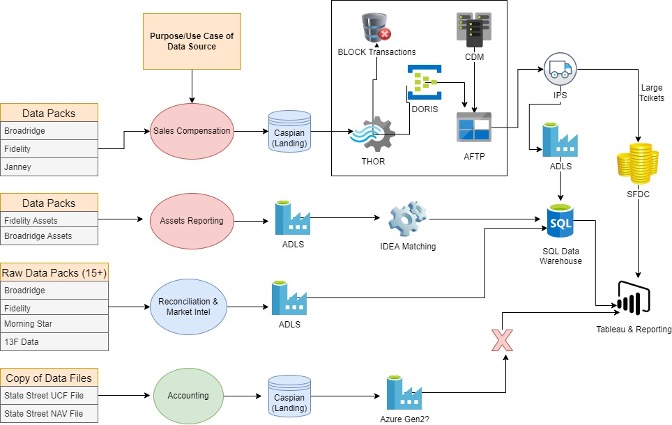
Lead the development and optimization of ETF data analytics infrastructure while managing a comprehensive suite of products worth $31 billion in AUM. Successfully integrated 9 distinct data sources while building robust ETL pipelines that enhanced market transparency and operational efficiency.

ETF AnalyticsData Pipeline ManagementPython & SQL
867
Files Processed
24+
Internal Reports
36
Dashboards Created

Capital Group ETF Dashboard

Comprehensive insights into Capital Group's ETF product lineup and performance.

Capital Group's ETF Journey

Capital Group's entry into the ETF market represented a strategic expansion of its product lineup, combining the company's legacy of active management with the operational infrastructure required for ETF innovation.

Launch Timeline

Wave 1 - February 2022

Initial suite of six equity ETFs established Capital Group's ETF presence.

Wave 2 - October 2022

Expansion with fixed-income offerings including Multi-Sector ETF, Municipal Income ETF, and Short Duration ETF.

Wave 3 - September 2023

Added Dividend Growers ETF, International Equity ETF, Core Bond ETF, Core Balanced ETF, and Short Duration Municipal Income ETF.

Wave 4 - June 2024

Launch of Conservative Equity ETF, International Core Equity ETF, Global Equity ETF, New Geography Equity ETF, Short Duration High-Income ETF, and International Bond ETF.

ETF Growth

Over two years, Capital Group launched 0 ETFs, representing over $0 billion in AUM.

Total ETF Products

21New Product Line
Across equity and fixed income

Total Sales

$31B+Growing
Since initial launch

Market Coverage

99.9%High Visibility
Trading activity captured

Data Latency

30sFrom 15min
Near real-time processing

ETF vs. Mutual Funds Comparison

Feature ETFs Mutual Funds
Trading Intraday on exchanges End-of-day at NAV
Pricing Market price (may vary from NAV) NAV calculated after market close
Transparency Daily holdings disclosure (typically) Quarterly holdings disclosure (typically)
Tax Efficiency Generally more tax-efficient due to in-kind creation/redemption Less tax-efficient due to cash transactions
Minimum Investment One share Varies (often $1,000+)
Data Infrastructure Multiple third-party sources required Centralized transfer agent data

ETF Product Portfolio

Capital Group's comprehensive suite of ETF offerings across equity and fixed income markets, as of May 20, 2025.

Primary Market Process

Understanding ETF creation and redemption mechanisms.

ETF Creation & Redemption Process

Creation Process

Authorized Participants (APs), often large financial institutions, work directly with the ETF issuer to create new ETF shares.

APs deliver a "creation basket," which consists of the securities underlying the ETF (or equivalent cash). In return, they receive an equivalent number of ETF shares at the net asset value (NAV).

Redemption Process

APs redeem ETF shares by returning them to the issuer. In exchange, they receive the underlying securities or cash at the NAV.

This mechanism ensures the ETF's supply matches market demand.

ETF Creation and Redemption Process Diagram

Interactive ETF Process

Interactive ETF Process Flow

NAV Calculation

How NAV is Calculated

The Net Asset Value (NAV) represents the per-share value of the ETF and is calculated daily.

NAV = (Total Assets - Total Liabilities) / Shares Outstanding

NAV vs. Market Price

ETFs can trade at a premium or discount to their NAV, though arbitrage mechanisms generally keep these differences small.
Secondary Market

How ETF shares are traded on exchanges between investors.

Secondary Market Trading

Retail and institutional investors buy and sell ETF shares in the secondary market through exchanges via brokers, similar to trading individual stocks.

Prices on the secondary market are determined by supply and demand, fluctuating throughout the trading day.

Unlike mutual funds, which settle at end-of-day net asset values (NAVs), ETFs require real-time price discovery mechanisms to maintain parity between market prices and underlying assets.

Secondary Market Trading Diagram

Arbitrage Mechanism

ETF Arbitrage Mechanism

Role of APs and Market Makers

APs and market makers use arbitrage to ensure the ETF's market price aligns with the NAV.

  • If the ETF trades above its NAV, APs create shares to increase supply, lowering the price.
  • If it trades below, they redeem shares to decrease supply, raising the price.

This dual-market structure ensures liquidity, efficient pricing, and a seamless investment vehicle for a wide range of participants.

ETF Trading Volume by Venue

ETF trading activity occurs across multiple venues, requiring comprehensive data integration to achieve complete market transparency.